Runtime Debugging in GoLang
Go (also known as Golang or Go language) is the language developed by Google. Go is an open-source, statically-typed compiled, and explicit programming language. According to Google Developers, Go is a dependable and efficient programming language. Golang also comes with a great debugging tool name Delve.

Delve comes with an inbuilt client and sever debugger which can be used to debug complex codebase on the go without recompiling and executing a binary. For example, let say a go program name main is running in the background and you want to debug some issue on the fly, you just have to start the delve debugger server and use your local machine to debug it using the client debugger.

Delve client attached with the process using the PID and open an API endpoint on the provided port. The client uses the JSON-RPC to communicate with the debugger server.
Prerequisites:
- Go Lang (Follow the link to install Go Lang)
- Delve (The go debugger)
- Compile the code using
-gcflags=all='-N'
Use the below command to install delve in windows and Linux.
go get github.com/go-delve/delve/cmd/dlv
Ensure delve installed properly using this commanddlv version
Let’s start debugging:
- Start delve debugging server where the go binary process is running
dlv --listen=:2345 --headless=true --api-version=2 attach $(pidof process)This command will start debugging the server at port 2345 which is attached to the process using the PID. Just make sure port 2345 is open in the firewall if you want to use your local machine as a client.
- Now connect to the debugging server using
dlv connect :2345
- From your machine use the command as follows:
dlv connect 192.168.1.82:2345
Some common delve commands:
- Add a breakpoint in the code.
break [breakpoint-name] [file-name]:[line-number]
(dlv) break bp1 pkg/api/rest/routes.go:65- List all breakpoints
(dlv) breakpoints
- Clear breakpoints
clear [breakpoint-name]
(dlv) clear bp1  clear all breakpoints
(dlv) clearall
- Print a variable
print [variable-name]
(dlv) print myURL- Move to next line of code
(dlv) next
- Continue execution
(dlv) continue
- Step in a method
(dlv) step
- Step out of the method
(dlv) stepout
- Print whole stack trace
(dlv) stack
For more commands follow this link
Bonus: Use Goland IDE as the client instead of the command line.
- Open your project in Goland make sure you are using the same source code which is used to compile the running process of it may cause conflict in debugging.
- Click on the Dropdown menu and select edit configuration

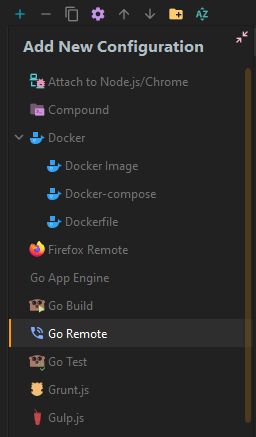
- Click the + sign

- Select Go Remote
- Fill in host IP and port and click on apply

- Now add breakpoints in the source code where you want to debug.
- Run debugging server on the remote machine using the command mentioned above
- Select configuration and click on the debug icon this will start a remote debugging session

- the debugger will look like this

- Execute some code for debugging the data will be reflected in the debugger
References: